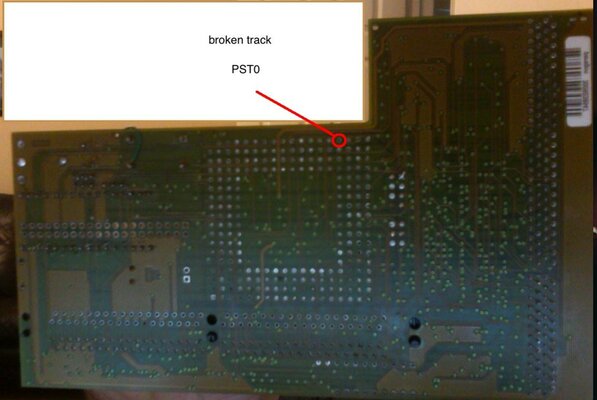
I was looking at the card that is my current work in progress and I cannot see any traces going from that pin to anywhere on the board. I tried to capture an image in a lighting that shows the traces inside the board. Also went through the board with a multimeter and found nothing connected to that pin. Have you checked from the CPU specs what the PST0 connection is for? Perhaps it is unused and there is some other problem with the board...
edit:
PST0-4 appear to be processor status and sounds like some sort of debug feature without looking it up . So might be not connected in production devices.
ah you could be right , i can find no connection for it at all. So hopefully its not needed. i'll investigate more in the week.
While I'm at it i better try fixing another battery damaged Apollo - no tracks at all on the F74 ... happy days
oh for schematics
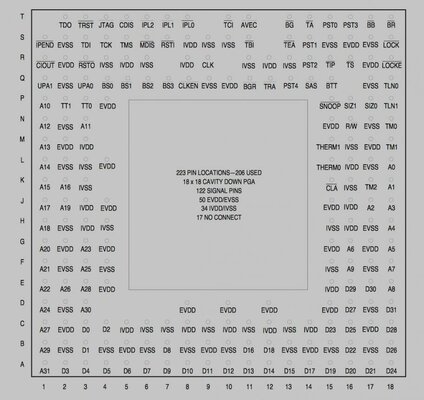
Processor Status (PST4–PST0)
2.10.1 Processor Status (PST4–PST0) These outputs indicate the internal execution unit status. The timing is synchronous with theMC68060 processor clock (CLK), and the status may have nothing to do with the currentbus transfer. Table 2-7 lists the definition of the PSTx encodings. The encodings $16, $17, and $1C indicate the present status and do not reflect a specificstage of the pipe. These encodings persist as long as the processor stays in the indicatedstate. The default encoding $00 is indicated if none of the above conditions apply. Mostother encodings indicate that the instruction is in its last instruction execution stage. Theseencodings exist for only one CLK period per instruction and are mutually exclusive. In general, the PSTx bits indicate the following information: PST4 = Supervisor Mode
PST3 = Branch Instruction
PST2 = Taken Branch Instruction
PST1, PST0 = Number of Instructions Completed that Cycle
Coldfire data sheet info
7.0 Startup Reset Sequence When P&E software starts up by default, it will attempt to drive the processor into background mode viaa reset. This is accomplished by first driving the BKPT, DSI, and DSCLK signals low. The reset signalon Pin-7 of the BDM header is then driven low for 20+ msec and released. At this point, if the processorhas correctly entered background mode, the PST0 (Pin-15), PST1 (Pin-14), PST2 (Pin-13) and PST3 (Pin-12) lines should all be driven high by the processor. Subsequently the user should see activity (changingsignals) on the DSI, DSO, and DSCLK signals. The activity on the DSCLK and DSI lines is generated bythe PC and the activity on the DSO line is generated by the processor. If you get the message “Cannot enter background mode,” this indicates that PST3/2/1/0 did not all gohigh. You should check your hardware with a scope, logic analyzer or logic probe. Make sure there ispower and clock to the ColdFire and then check the startup sequence given above.
Hmm.. PST0/1 seem very interesting from my perspective. If I connect them to my scope channels I could monitor real time how well any particular routine utilises the superscalar pipeline. I may need to look more into this
This site uses cookies to help personalise content, tailor your experience and to keep you logged in if you register.
By continuing to use this site, you are consenting to our use of cookies.
")